Jul 17, 2014 Danielle Laurion
This week, Twitter announced an analytics dashboard specifically for organic tweets. There is already a dashboard for measuring Promoted Tweets, but now for the first time, advertisers, Twitter card publishers and verified users can see how the tweets they haven’t paid for are doing – in real-time.
Organic Twitter analytics dashboard:
With the new Twitter dashboard you can:
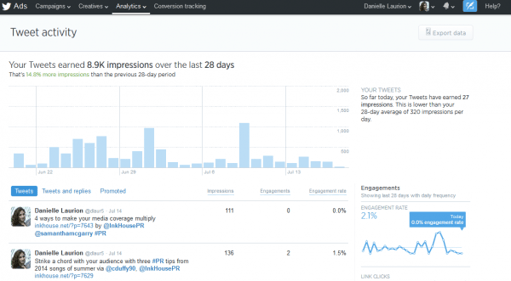
- See how your tweets are performing in real time.
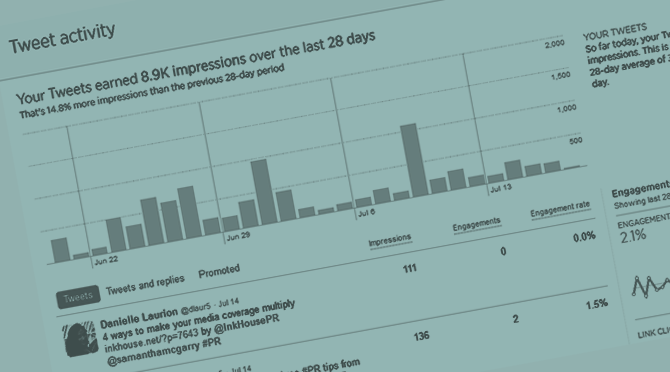
- Compare impressions (times a tweet is viewed by anyone on Twitter web and Android or iOS apps, including logged-out users), total engagements and Retweets month over month.
- Use the tweet details page to see how many Retweets, replies, favorites, follows, link clicks and embedded media clicks each Tweet received.
- Export your tweet performance metrics into a CSV file, which now includes both organic and promoted data.
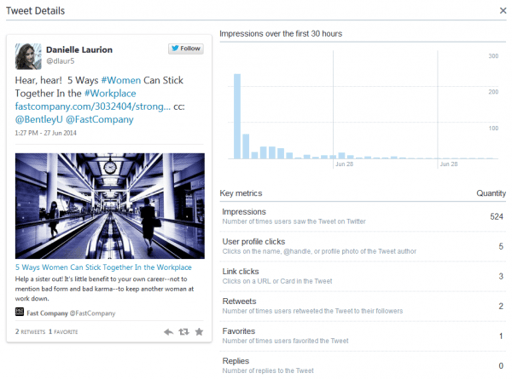
The dashboard gives you the option to look at organic tweets, tweets and replies, and promoted tweets to see how each is performing. To dive even deeper into analytics, you can click on an individual tweet to see how the tweet performed over the first 30 hours and the total number of impressions, user click profiles (clicks on the name, @handle, or profile photo of the tweet author), link clicks, detail expands (number of times users clicked on the tweet to view more details), replies, retweets and favorites.
Insights from brands’ analytics
In order to help show this new dashboard’s value and to provide helpful Twitter best practices to increase engagement, Twitter looked at the data for “200 active brand advertisers” and found some patterns. First, consistency is key. Twitter posted that brands who tweet two to three times per day can reach an audience that’s equal to 30 percent of their follower base during a given week. The 200 brands that drove the highest organic reach utilized one or more of these tactics:
- Leverage real-time cultural moments like live sports events, awards shows or trending conversations.
- Mention influencer usernames with large followings or high-volume hashtags in tweets.
- Include auto-expanded photos or videos paired with short, conversational copy.
Dashboard analytics best practices
The new organic analytics dashboard can help you and your brand identify the best performing tweets and where your content can improve. Twitter recommends a few ways to use the dashboard to help improve your content strategy:
- Pay attention to when you tweet. Note which time of day and day of the week yields the highest engagement and impressions.
- Analyze the frequency of your tweets. Use your new insights to determine your tweet cadence.
- Identify what tweet mechanics work, and which aren’t as effective. Keep an eye on elements like different calls to action, the inclusion of rich media and copy length.
If you’re not a verified Twitter user, you can create an advertiser account by signing up here.