
Sep 06, 2017 admin
Share of voice (SOV) seems to be the new ‘must have’ in many PR reports and measurement programs. For those unfamiliar, SOV is like a market dominance / market share analysis that sales and marketing typically look at, but for brand awareness. Generally, there are two ways we look at SOV in public relations - by news article (“clip”) volume or by media impressions, and it’s usually represented as a pie chart.
I’ll get into how to calculate a SOV in just a second, but first let’s look at why SOV is important to the modern PR professional.
A SOV analysis can be helping in a number of ways:
- It can provide a benchmark against your competitors, showing how visible each company is, relative to the rest.
- It can help communications pros find the “white space” or opportunities available by digging into what is driving competitor’s share of coverage or visibility
- It supports prioritization of competitors
SOV is a more useful metric compared to simple impressions or clip volume because it can provide more context and, since it’s similar to a market share report, it tends to be easier for non-PR pros to understand.
Get out your calculators! (Well… Excel spreadsheets)
If you’re not using a PR monitoring and analytics system like TrendKite or Cision that will calculate a SOV for you, it’s easy enough to do manually. Below is the basic setup needed to run a SOV pie chart in Excel/Google Sheets, based on clip volume. Obviously, you’ll need to keep a running count of coverage for each company to get at these overall numbers, but you get the point.
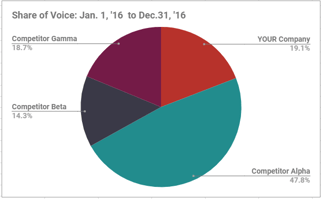
SOV: Jan 1, 2016 to Dec 31, 2016
| Company | Clip Volume |
| YOUR Company | 100 |
| Competitor Alpha | 250 |
| Competitor Beta | 75 |
| Competior Gamma | 98 |
(Select all, insert chart, select pie chart and voila!)
While you can do a SOV based on either clip volume or impressions, remember that those metrics are not proportional to each other. There are pros and cons to both, so pick one way and stick with it for all reports.
Make your SOV more valuable
There are limitations to SOVs based solely on volume of coverage or impressions. For example, use of a wire service to distribute press releases might inflate a company’s coverage volume or, when comparing public vs private companies, you’ll need to account for the volume of financial coverage. That said, there are ways to make the metric more meaningful to help uncover useful insights.
- Share of coverage within a target vertical: If your company wants to grow or compete in a specific segment, you could limit the coverage you’re evaluating to a specific list of relevant trade media or industry specific keywords.
- Geography: Have geographical area that you’re trying to break into or gain market share? Only look at coverage from a specific city, state or region.
- Thought leadership: If beating competitors at executive thought leadership is the goal, search and count only coverage that features the executive’s commentary, bylines from the executive or executive profiles.
Bottom line, SOV is a flexible and useful metric when used correctly and in concert with other metrics and strategic considerations. No calculus required.