Oct 31, 2011 admin
A few weeks ago I received some blog topic inspiration from a pretty unlikely source – a fortune cookie. It was not a 2010 InkHouse holiday fortune cookie, nor was it found under Jim’s desk. It was a regular, comes-with-your-takeout-Chinese-food fortune cookie.
My fortune read, “Good writing is clear thinking, made visual.” While it wasn't exactly the fortune I'd hoped for (piles of money), it did give me pause as I pondered these wise, Far East words. I thought of how to apply this thinking to the work we do at InkHouse, where much of our writing is data-heavy and technical, making some of the subject matter appealing to only very narrow audiences. I thought, “How can we more effectively write a case study on carperpetuation or schlattwhappers that people will remember an hour after reading?”
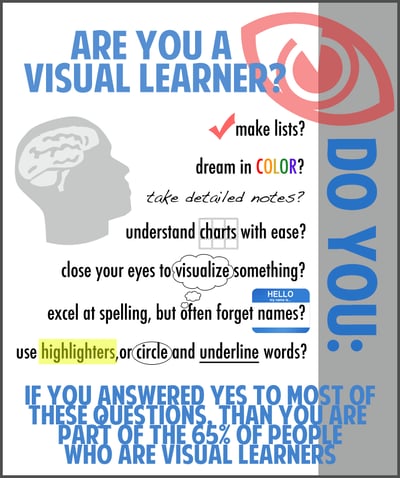
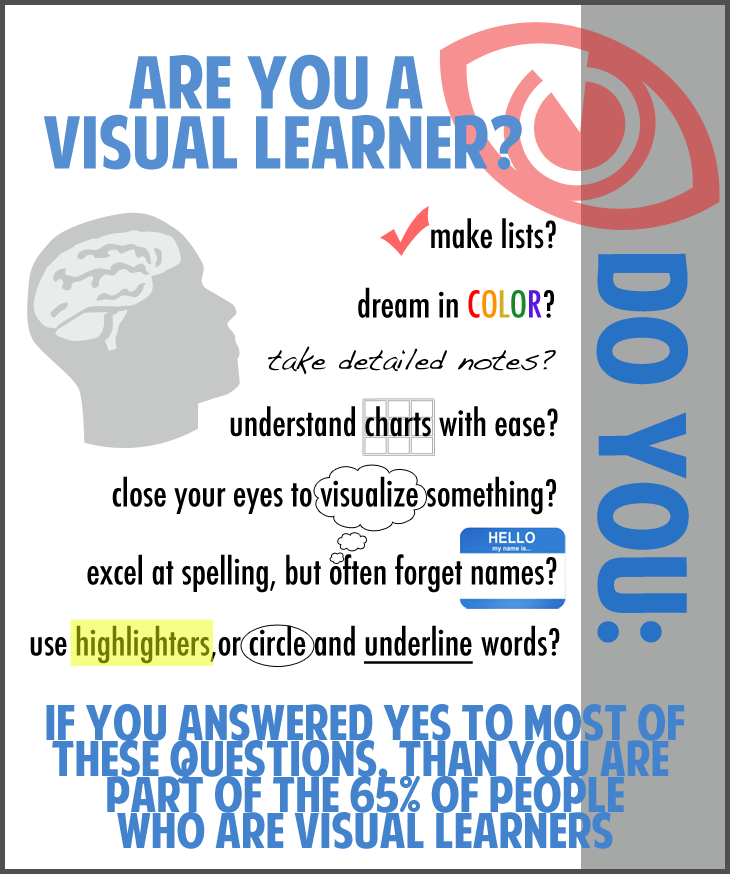
There aren’t many purely textual works that I can recall facts from off the top of my head. But I can tell you the weather for the next five days thanks to the morning news weather graphics I saw this morning. Does that mean that almost everything I’ve read has been written poorly? No. It just means that it wasn’t presented in a way that my brain could retain the data. That makes me part of the approximately 65 percent of the world population that are considered visual learners. This means that more than three billion people link key ideas and information with images in order to retain and understand what they are learning.

A company or business could be failing to reach a much broader audience if they are relying solely on written text. Thankfully, the realization that there are creative ways to more effectively reach those three billion people is starting to catch on. Tools such as infographics have gained a lot of popularity over the past few years. Data, such as survey results, is far more compelling to visual learners when laid out graphically rather than solely revealed in a textual report. Some great examples of infographics can be found on sites like visual.ly and dailyinfographic.com.
We all learned with images before we could read or write (think picture books and flash cards), and even as adults, most people are still reliant on visual elements to retain information. Luckily, with technology such as Photoshop and PowerPoint, and creative agencies such as InkHouse, incorporating visuals into your messages is easier than ever. And you don’t have to take my word, or infographic, for it.